
Appearance
Discovering and Exploring Data Sources
The Explorer view lets you discover, browse, and evaluate geospatial data catalogs, data sources, and datasets before setting up ingestion.
Discovering Data Sources
Select Explorer from the main menu. Enter an OGC web service endpoint URL and click EXPLORE to discover and connect to the service.
OGC CSW URL Format
As an example of an OGC CSW service, the typical CSW URL format is:
https://<server-domain>/<path>?service=CSW&request=GetCapabilitiesYou can omit the query parameters (everything after the question mark) and enter just the base URL:
https://<server-domain>/<path>The Connector will automatically detect the full endpoint format and test connectivity to the service.
Authenticated Services
If a data source requires credentials (such as an API key or password), do not include them in the URL. Instead:
- Enter the base service URL without credentials and explore the service
- Go to the Connections view and configure authentication for the saved connection (see Managing Connections)
- Return to the Explorer to access the authenticated service
The Connector will reject URLs that contain authentication parameters such as apikey, token, or password in the query string. This protects your credentials from being stored in logs and monitoring systems.
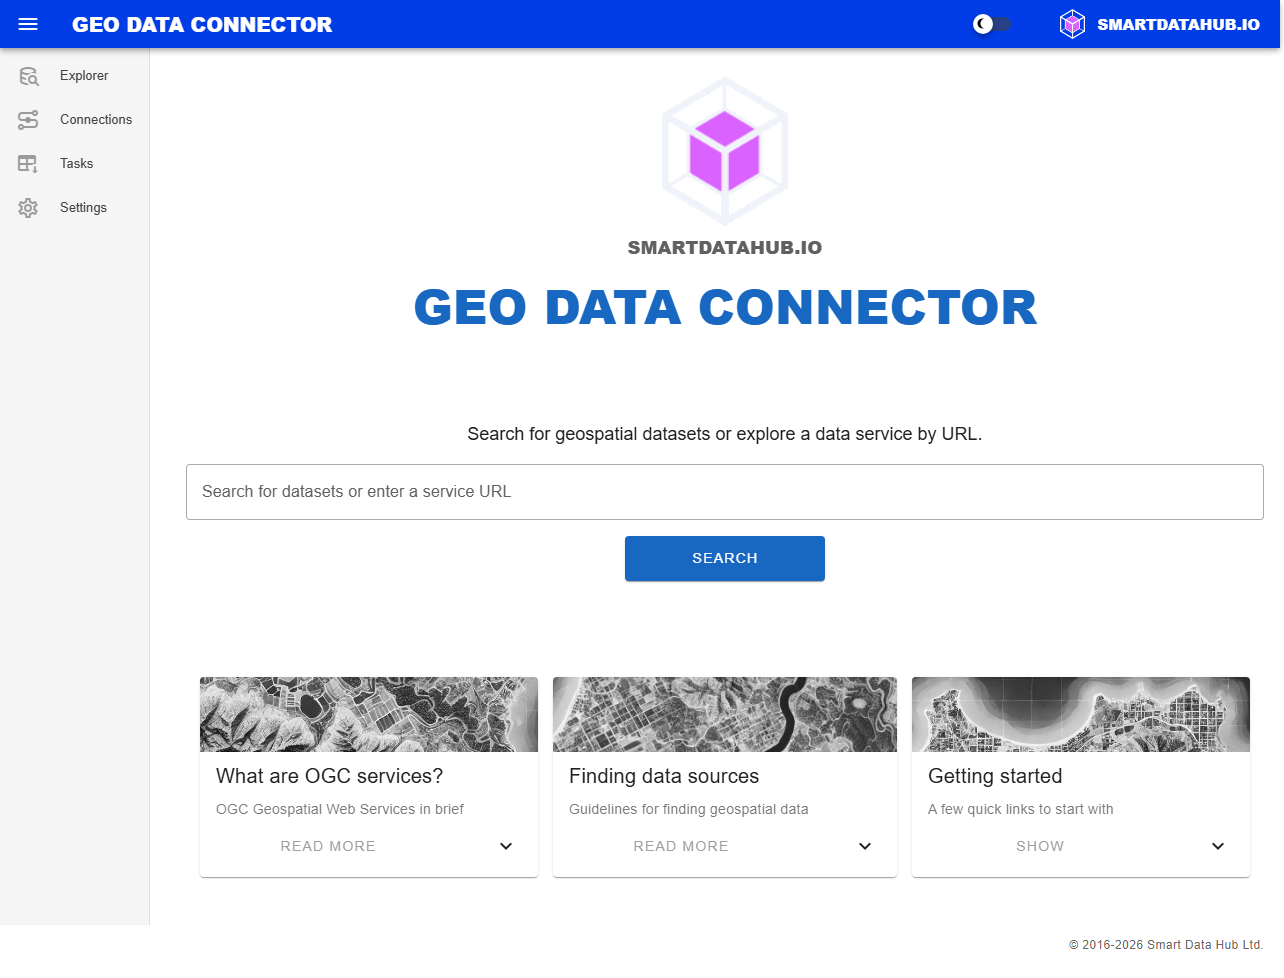
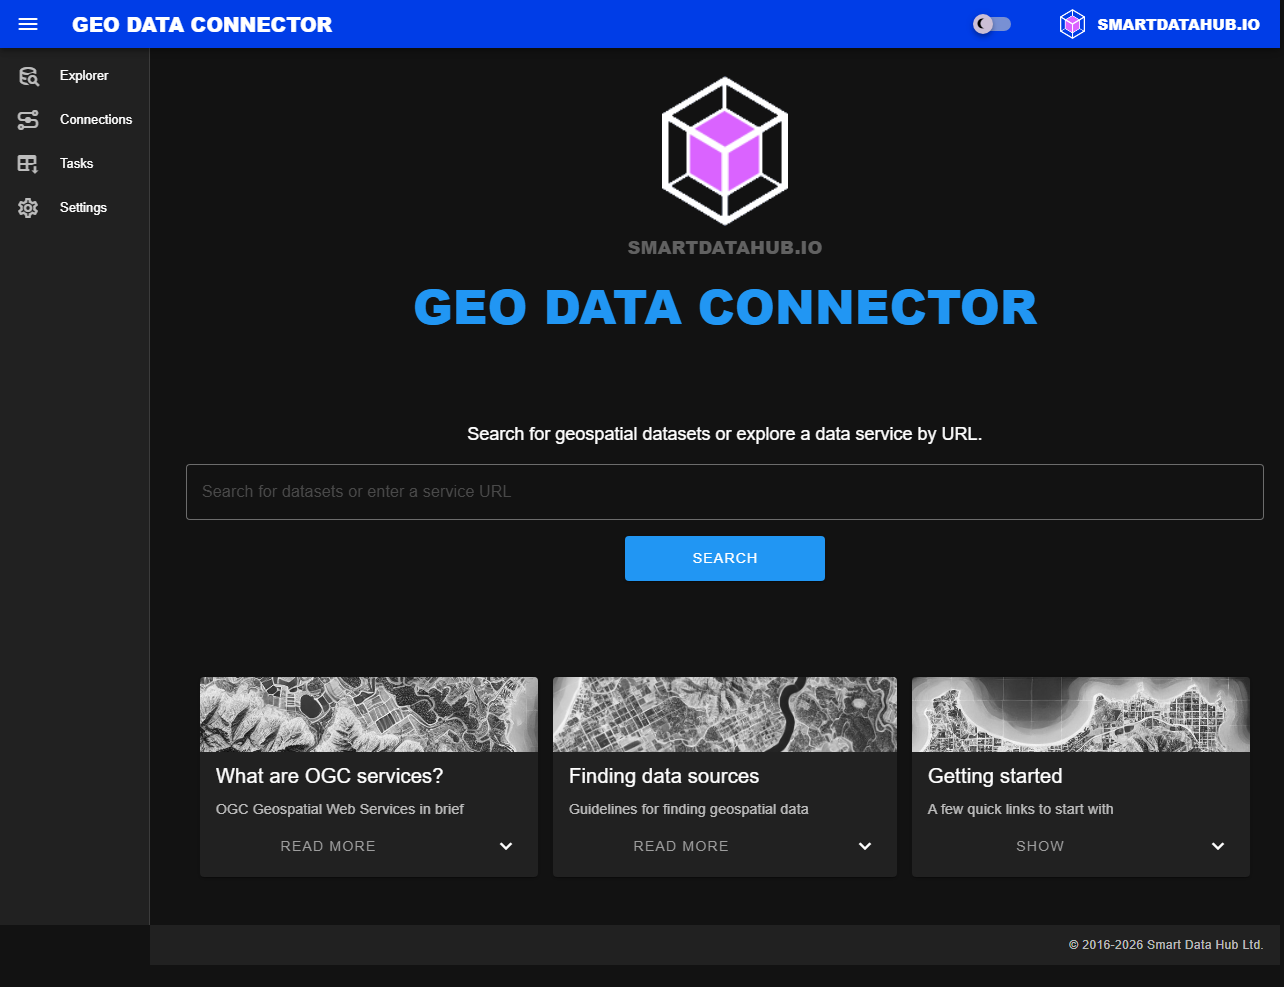
Explorer view with URL input and discovery helper cards
Using Discovery Helpers
Below the URL input field, three helper cards provide resources for getting started:
| Helper | Description |
|---|---|
| Left card | Background information about OGC services and URL formatting |
| Middle card | Tips for discovering new data sources and links to well-known data catalogs |
| Right card | Sample OGC endpoint URLs you can try immediately |
Exploring Discovery Findings
After clicking EXPLORE, the Connector discovers data sources at the URL, verifies connectivity, retrieves metadata, and displays the results in the Discovery Findings view.
Discovery Findings Metadata
| Column | Description |
|---|---|
| # | Sequential number for each data source |
| Title | Title of the data source (if available) |
| Description | Description of the data source (if available) |
| Type | Service type: WFS (vector features), WMS (map images), WMTS (tiled maps), WCS (raster coverages), WPS (processing services), CSW (catalog of additional data sources), or their OGC API equivalents — OGC API Features, OGC API Maps, OGC API Tiles, OGC API Coverages, OGC API Records (catalog), and OGC API Processes |
| Health | A colored indicator showing the connectivity status of the data source (see below) |
| Provider | Name of the service provider (if available) |
| Sources | Number of additional data sources in a catalog-type source |
| Datasets | Number of datasets in the data source |
| URL | Endpoint URL of the data source |
Note: The Provider and URL columns only appear when at least one data source has that information available.
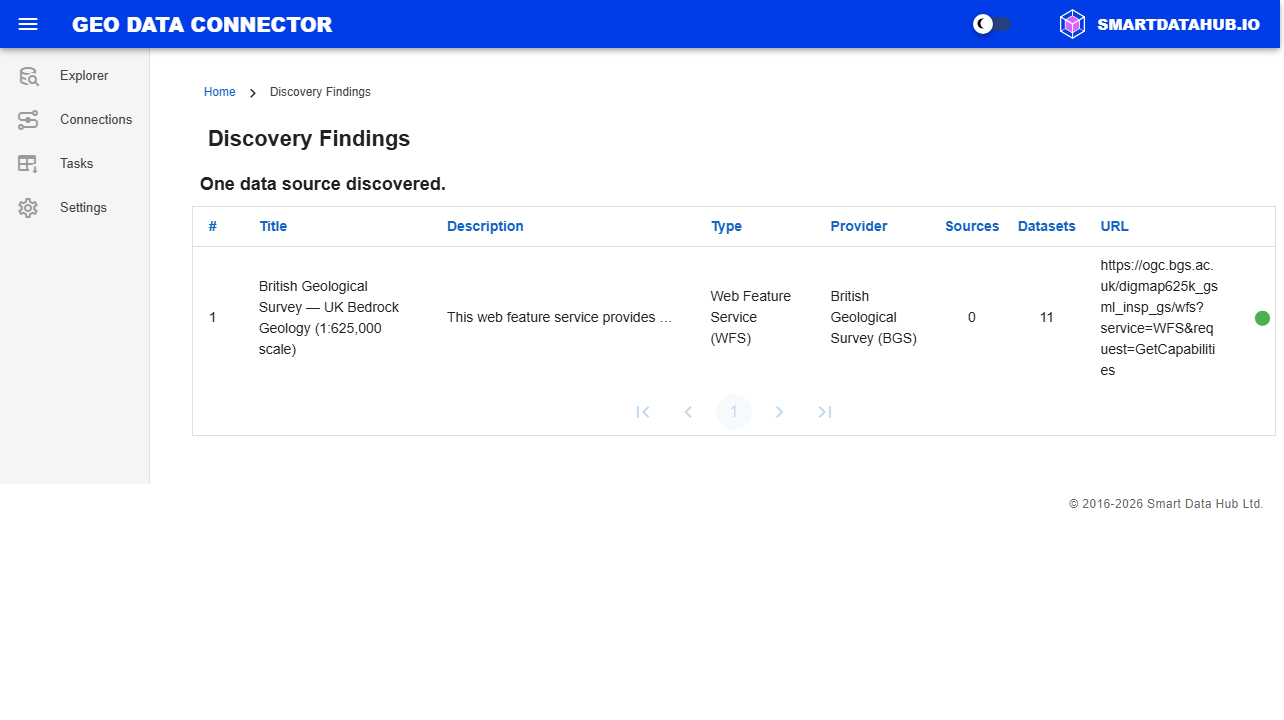
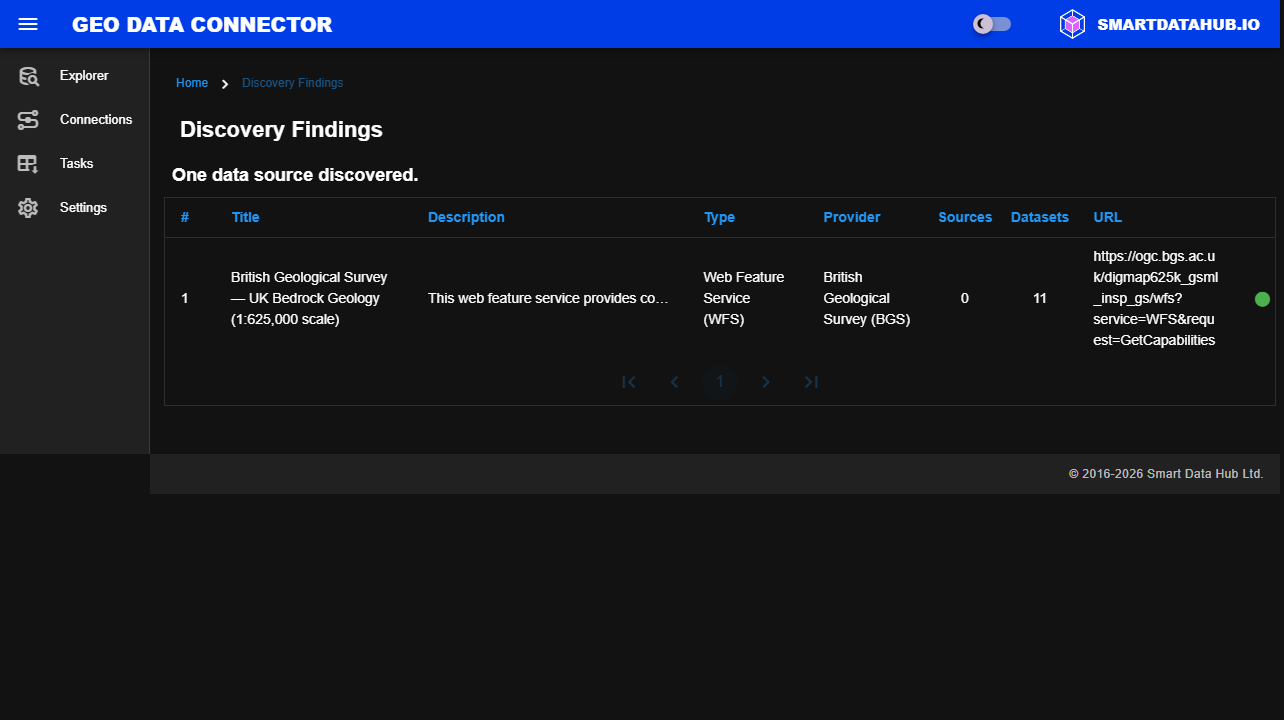
Discovery Findings view showing discovered data sources
Note: Some data services respond slowly, so discovery may take a few minutes. The Connector shows progress during discovery. If the process takes too long, it is interrupted — but discovery continues in the background and caches partial results. Retry after a few minutes to see the completed results.
Service Health Indicators
The Connector checks data source availability automatically at regular intervals. A colored health indicator appears throughout the application to show the current status:
| Indicator | Meaning |
|---|---|
| Green dot | The data source is responding normally |
| Orange dot | The data source is responding slowly |
| Red dot | The data source is currently unreachable |
| Gray dot | The data source has not been checked yet |
| Blue dot | The data source is being re-checked after a previous failure (HALF_OPEN) |
Hover over any health indicator to see additional details including the time of the last check, 7-day uptime percentage, and average response time.
Note: Health checks run automatically at regular intervals. The health indicator reflects the most recent check and may not represent the data source's current state at the exact moment you are viewing it.
Searching Within CSW Catalogs
When exploring a CSW (Catalog Service for the Web) data source, a search field appears above the results table. This lets you filter catalog records by keyword instead of browsing through all pages manually.
Note: The search field only appears for catalog-type data sources (CSW, OGC API Records) that support text filtering. Other service types do not show a search field.
Using the Search
- Type your search query into the field labeled "Search within catalog..."
- Press Enter or click the magnifying glass icon to submit
- The results table updates to show only matching records
- A summary appears below the search field showing the number of matches (e.g., "15 results for 'population'")
The search query must be at least 2 characters long. Shorter queries are ignored.
Clearing the Search
Click the X button in the search field to clear the filter and restore the full catalog listing.
Search and Pagination
When a search is active, pagination applies to the filtered results. Navigating between pages preserves your search query — you do not need to re-enter it.
| Behavior | Description |
|---|---|
| Minimum query length | 2 characters |
| Pagination | Search query persists across page changes |
| Clearing | Click the X button to restore all records |
| Availability | CSW catalogs with text search support only |
Exploring Data Sources
Click a data source in the Discovery Findings view to open the Data Source Information view with metadata and available datasets.
Data Source Metadata
| Field | Description |
|---|---|
| Type | Service type (e.g., OGC Web Feature Service) |
| URL | Endpoint URL of the data source |
| Health | Connectivity status of this data source, shown as a colored dot. See Service Health Indicators for color meanings and hover details. |
| Title | Title of the data source |
| Description | Description of the data source |
| Number of Datasets | How many datasets, layers, or collections are available |
| Keywords / Tags | Keywords assigned to the data source for discovery and context |
| Default and Available CRSs | The default coordinate reference system and all supported CRSs (e.g., EPSG:4326, EPSG:3857) |
| Data Formats Available | Output formats supported by the data source. During ingestion, the Connector converts all geographic data to a standardized format regardless of the source format. |
| Fees | Any costs or licensing fees associated with the data source. Fee arrangements must be handled directly with the data provider. |
| Access Restrictions | Authentication requirements, licensing agreements, and usage constraints. It is the user's responsibility to evaluate and fulfill any restrictions before ingestion. |
| Datasets List | All datasets, layers, or feature collections available from the data source |
For data sources containing many datasets, the list is paginated, displaying ten datasets per page. Clicking on a dataset row in the list opens the Dataset Information view, where you can see detailed metadata for the selected dataset.
Note: If a data service takes too long to respond when loading the dataset list, you may see a warning message at the top of the list — for example, "Couldn't fully load this service's datasets — try again." This means the Connector reached the service but could not retrieve the complete dataset list in time. Click Retry to load the list again. The service's datasets are still available — a retry usually succeeds once the service has warmed up or load has decreased.
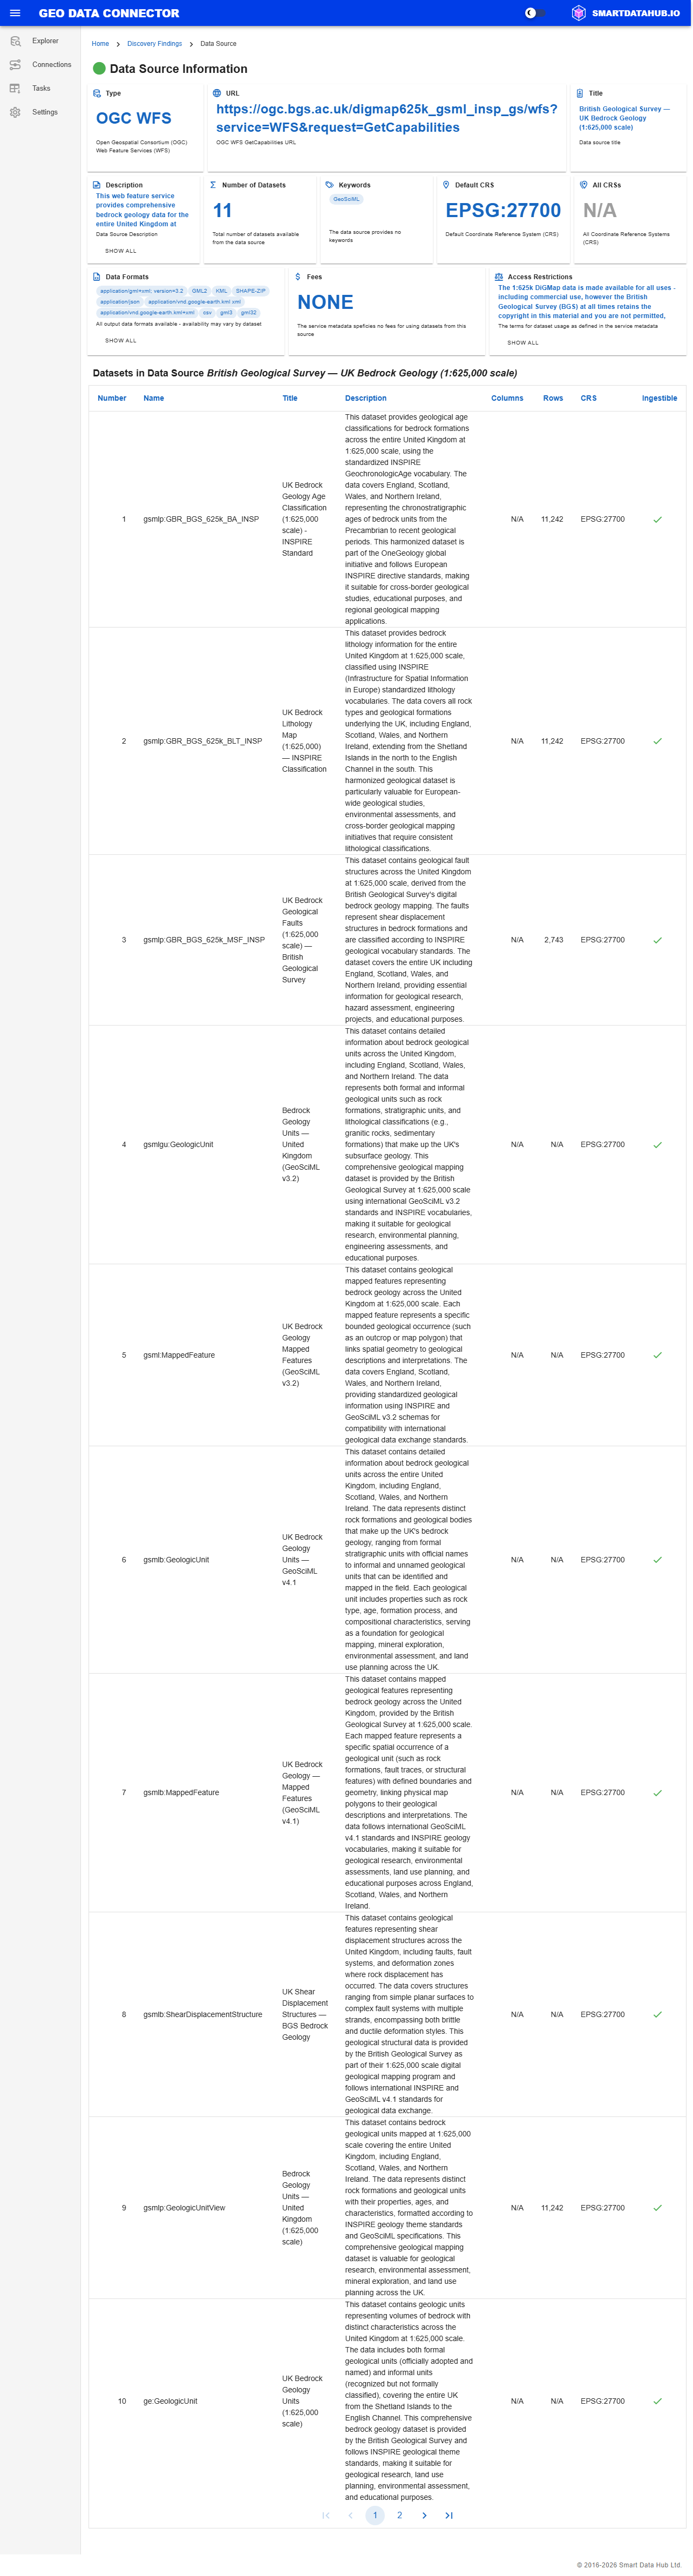
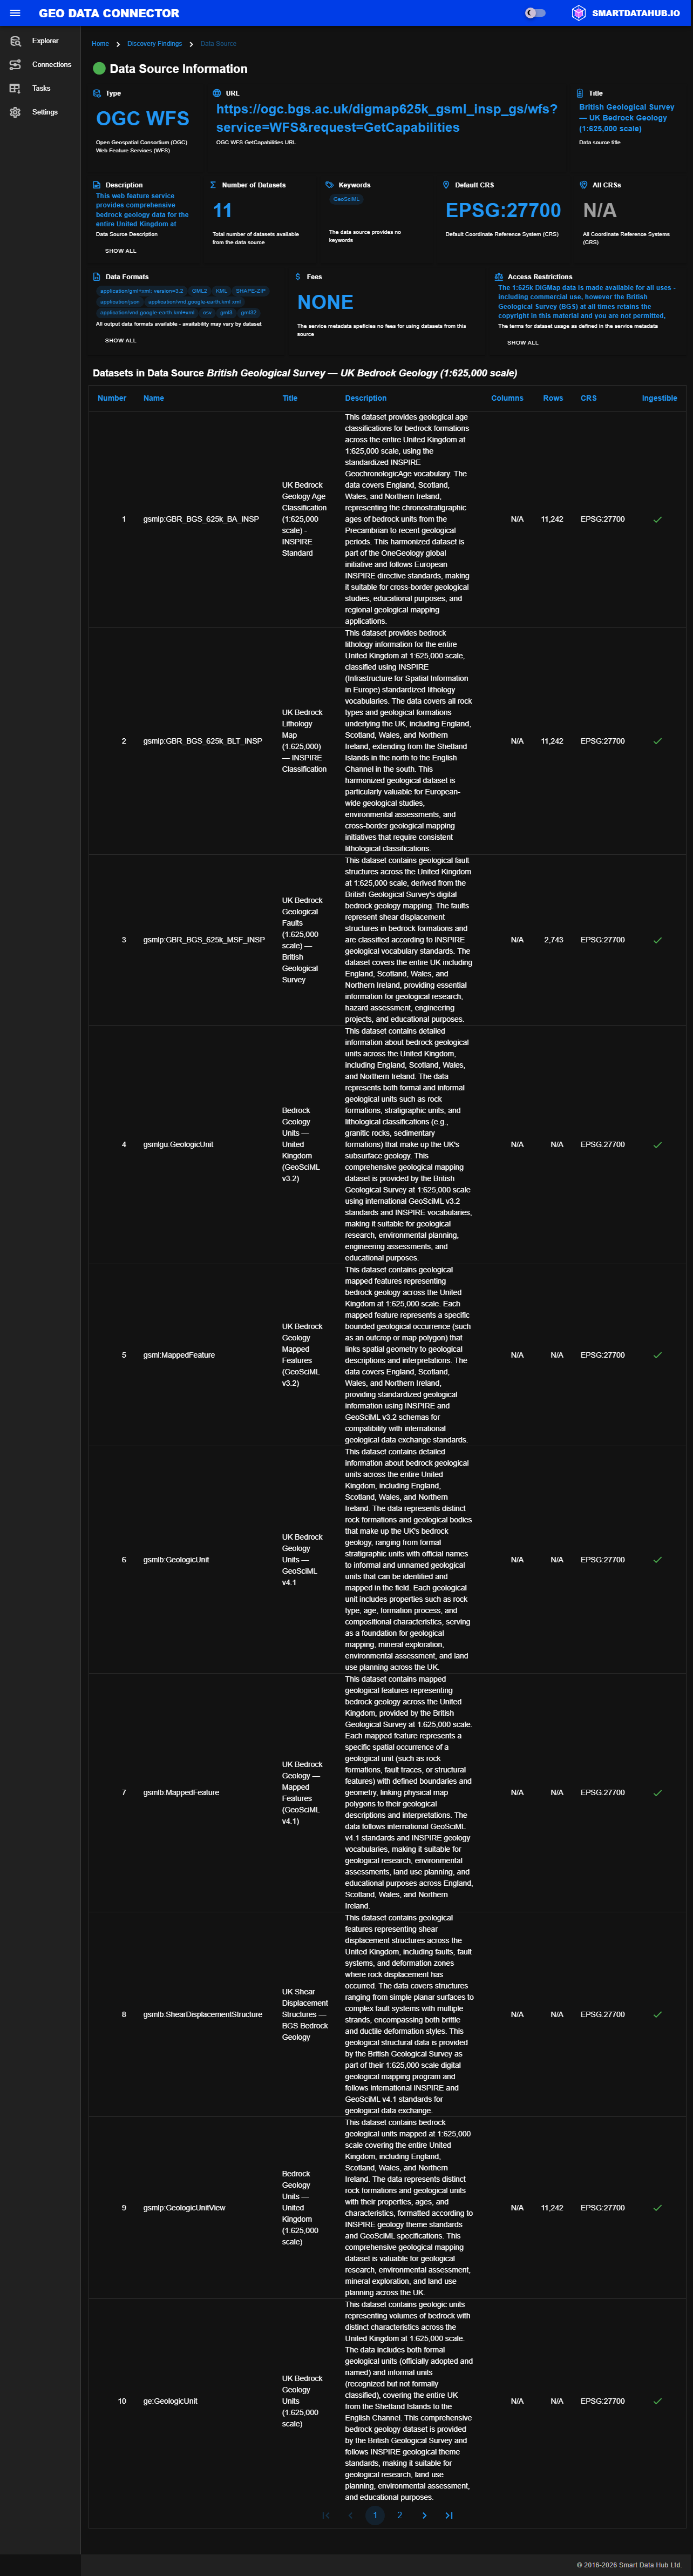
Data Source Information view with metadata and dataset list
Exploring Dataset Information
The Dataset Information view provides detailed metadata of each geospatial dataset accessible through a data source.
Dataset Metadata
| Column | Description |
|---|---|
| Number | Sequence number of the dataset within the data source |
| Name | Internal identifier of the dataset (often a table or collection name) |
| Title | Human-readable title describing the dataset. A health indicator next to the title shows the connectivity status of the parent data source — see Service Health Indicators for details. |
| Description | Summary of the dataset's purpose and content |
| Columns | Number of columns or attributes in the dataset schema |
| Rows | Number of records or features in the dataset. For raster datasets, the row count is an upper-bound estimate and is displayed with a ~ prefix (e.g., "~1,200,000"). |
| CRS | EPSG code and name of the default coordinate reference system (e.g., "EPSG:4326 — WGS 84") |
| Ingestible | Whether the dataset can be ingested into Snowflake, shown as a green check (yes) or red X (no). On the Free edition, datasets that exceed the 10,000-row ingestion limit — or whose size is unknown — are shown as non-ingestible, with a tooltip explaining the reason. |
Size advisory
For very large datasets the Connector may show an orange warning icon next to an otherwise ingestible dataset. This is a size advisory: the dataset's estimated size exceeds the ingestion capacity, so an ingestion attempt is unlikely to complete in full. The tooltip shows the estimated size and the capacity limit. The advisory is informational — you can still explore the dataset, and the ingestion process itself makes the final determination.
Geographic Extent
Next to the metadata cards, a Geographic Extent map displays the dataset's geographic area on an interactive world map. The area is shown as a highlighted rectangle, and the map supports panning and zooming to explore the surrounding area. Below the map, a coordinate summary shows the exact extent in degrees (e.g., "Extent: 24.0°E to 32.0°E, 59.0°N to 71.0°N").
The map automatically adapts to the application's light or dark theme.
Note: Geographic extent is available when the data source provides geographic area information for the dataset. If this information is not available, the map card displays a "Geographic extent not available" message instead.
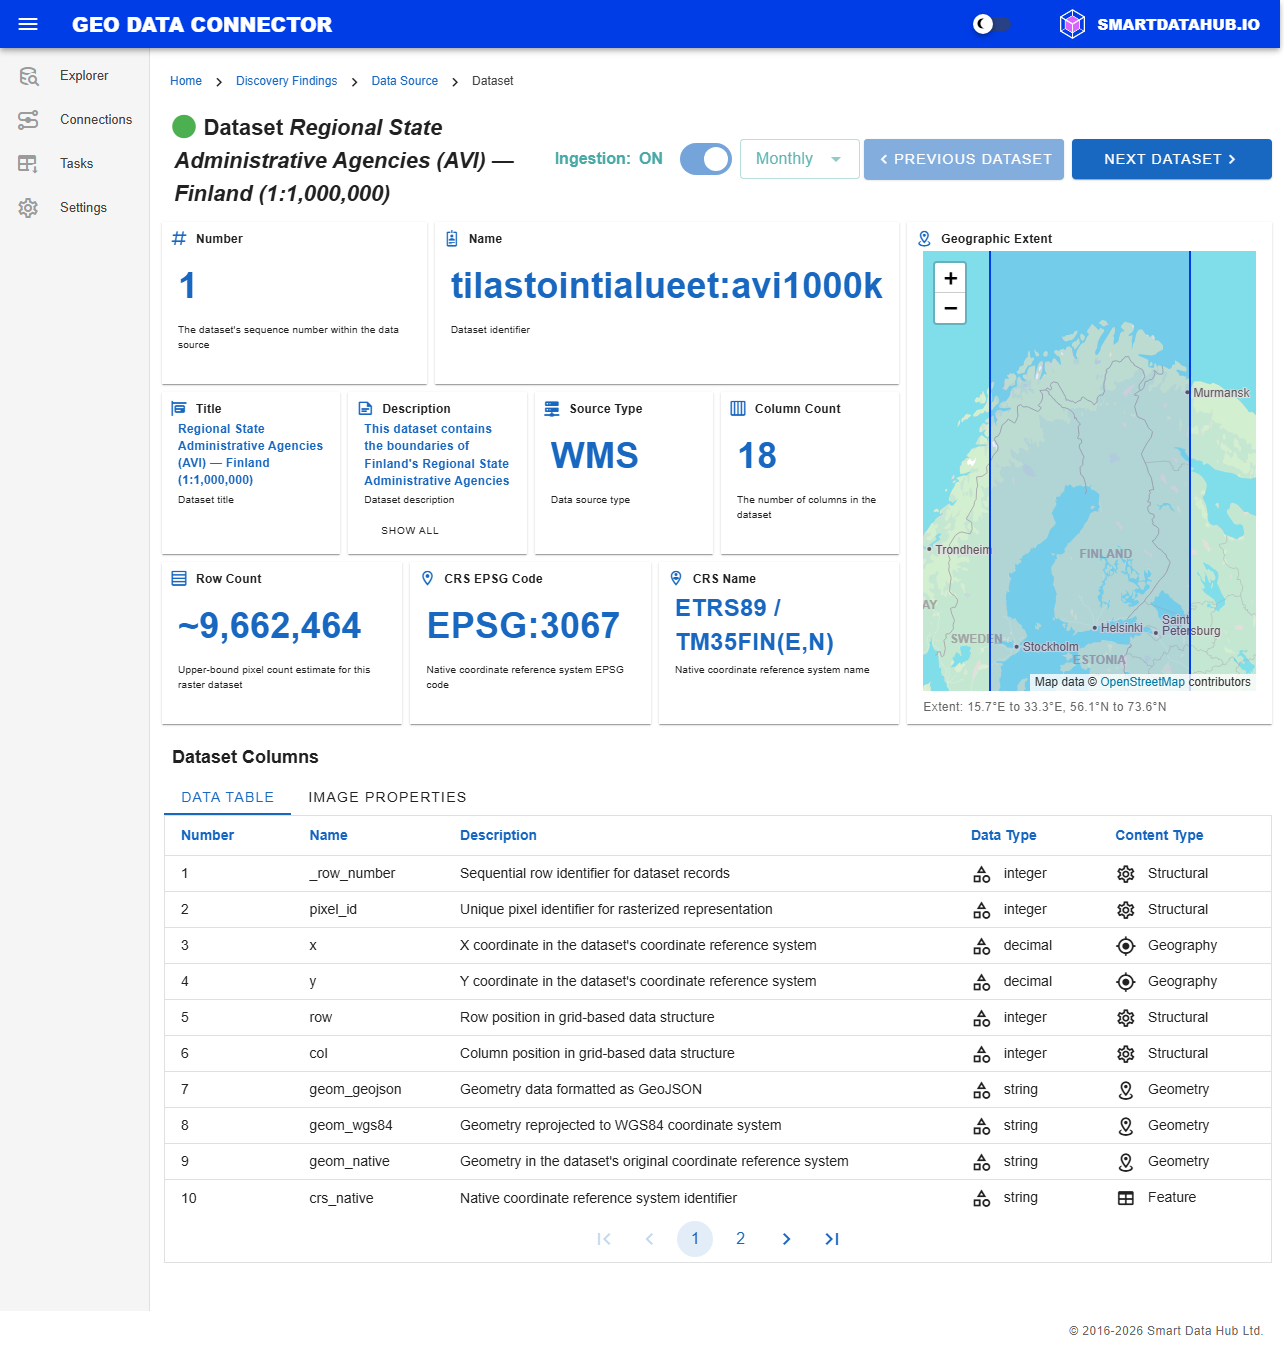
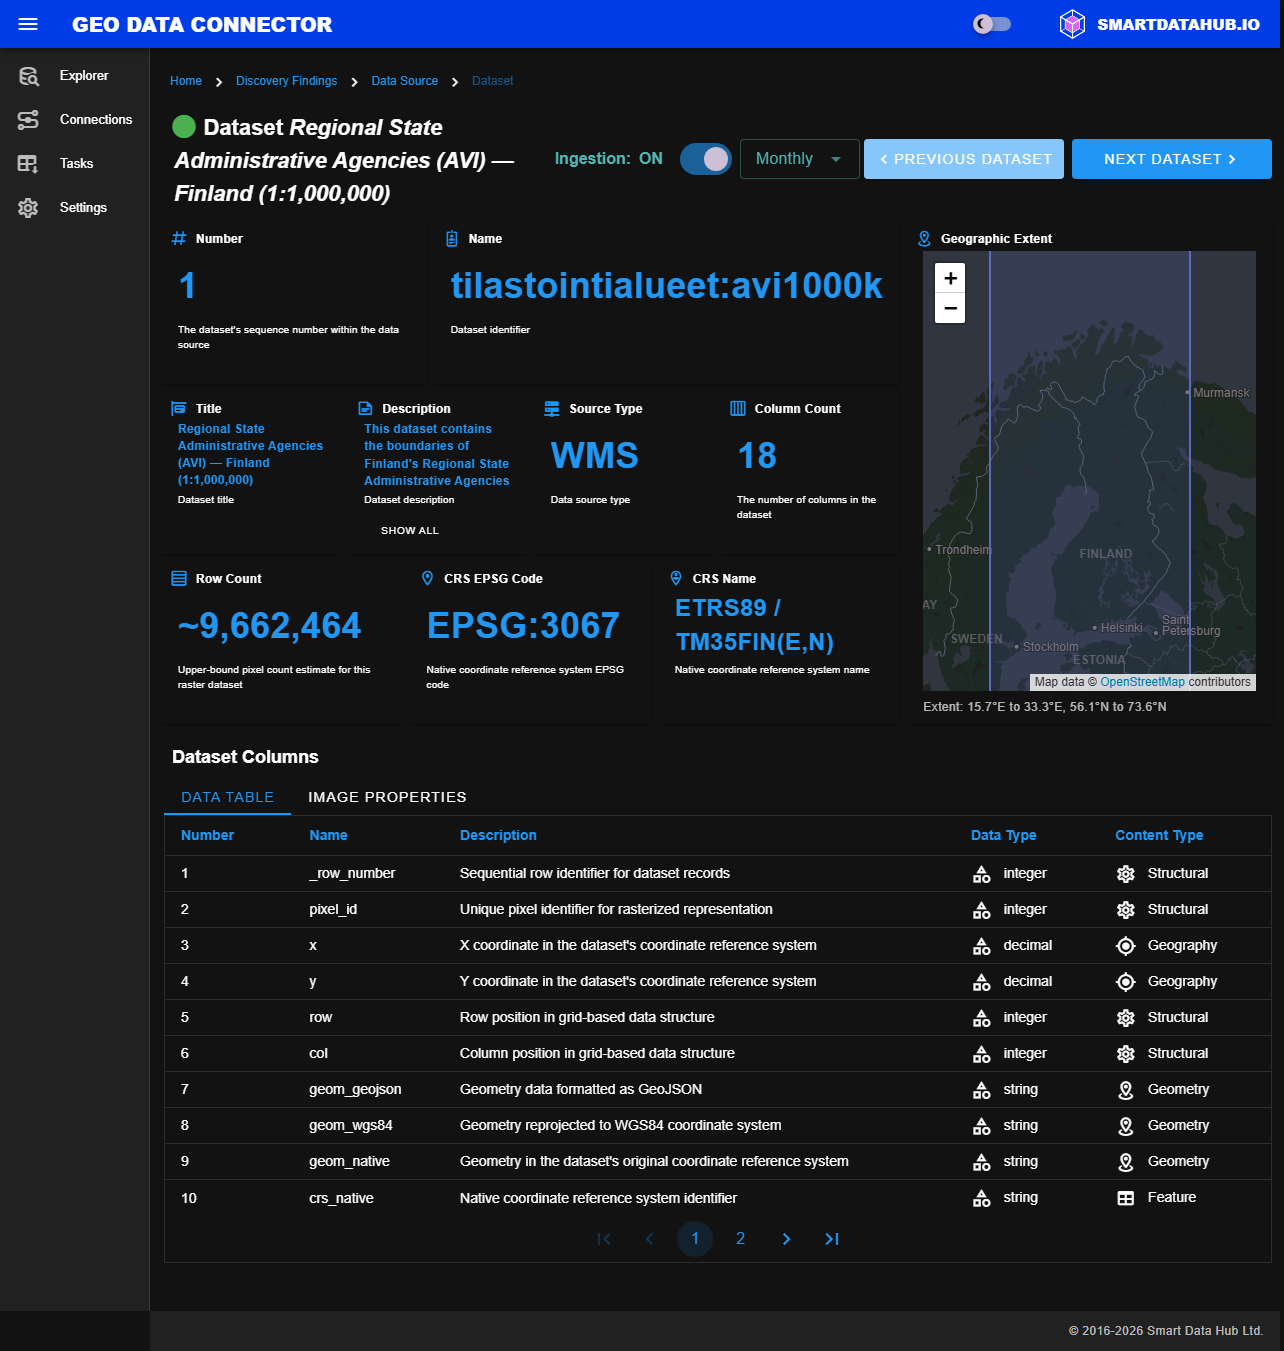
WMS dataset showing the Geographic Extent map with highlighted area rectangle
Dataset Columns
Below the dataset metadata cards, the Dataset Columns section displays the schema of the dataset in a tabular format.
| Field | Description |
|---|---|
| Number | Position of the column within the dataset |
| Name | Column name (e.g., id, geometry) |
| Description | Description of the column's purpose (if provided by the source) |
| Data Type | Data format (e.g., string, integer, decimal, datetime) |
| Content Type | The role of the column within the dataset (see table below) |
Content Type Categories
Each column is classified by its role in the dataset:
| Content Type | Icon | Description |
|---|---|---|
| Structural | Gear | Internal columns that support the data structure (e.g., _row_number, pixel_id, row, col) |
| Feature | Table | Source data values — attribute columns for vector data, band columns for raster data |
| Geometry | Map marker | GeoJSON spatial representation (geom_wgs84) |
| Geography | Crosshairs | Geographic coordinates (x, y) — appears only for raster datasets (WMS, WMTS, WCS, OGC API Maps, OGC API Coverages) |
Vector datasets (WFS, OGC API Features, OGC API Tiles) typically contain Structural, Feature, and Geometry columns. Raster datasets (WMS, WMTS, WCS, OGC API Maps, OGC API Coverages) additionally include Geography columns for the pixel coordinates.
Raster Dataset Tabs
When viewing a raster dataset from a WMS, WMTS, WCS, OGC API Maps, or OGC API Coverages data source, the Dataset Columns section includes two tabs:
- Data Table: Shows the pixel data columns that will be created in the ingestion target table. These include spatial coordinates (
x,y), pixel position (row,col), a GeoJSON geometry point (geom_wgs84), and one column per raster band (band_1,band_2, etc.). - Image Properties: Shows the raster metadata properties that will be stored in a companion metadata table. These describe the image characteristics such as coordinate reference system, pixel dimensions, band information, and geographic extent.
For vector datasets (WFS, OGC API Features), only the Data Table tab is shown, as there is no separate metadata table.
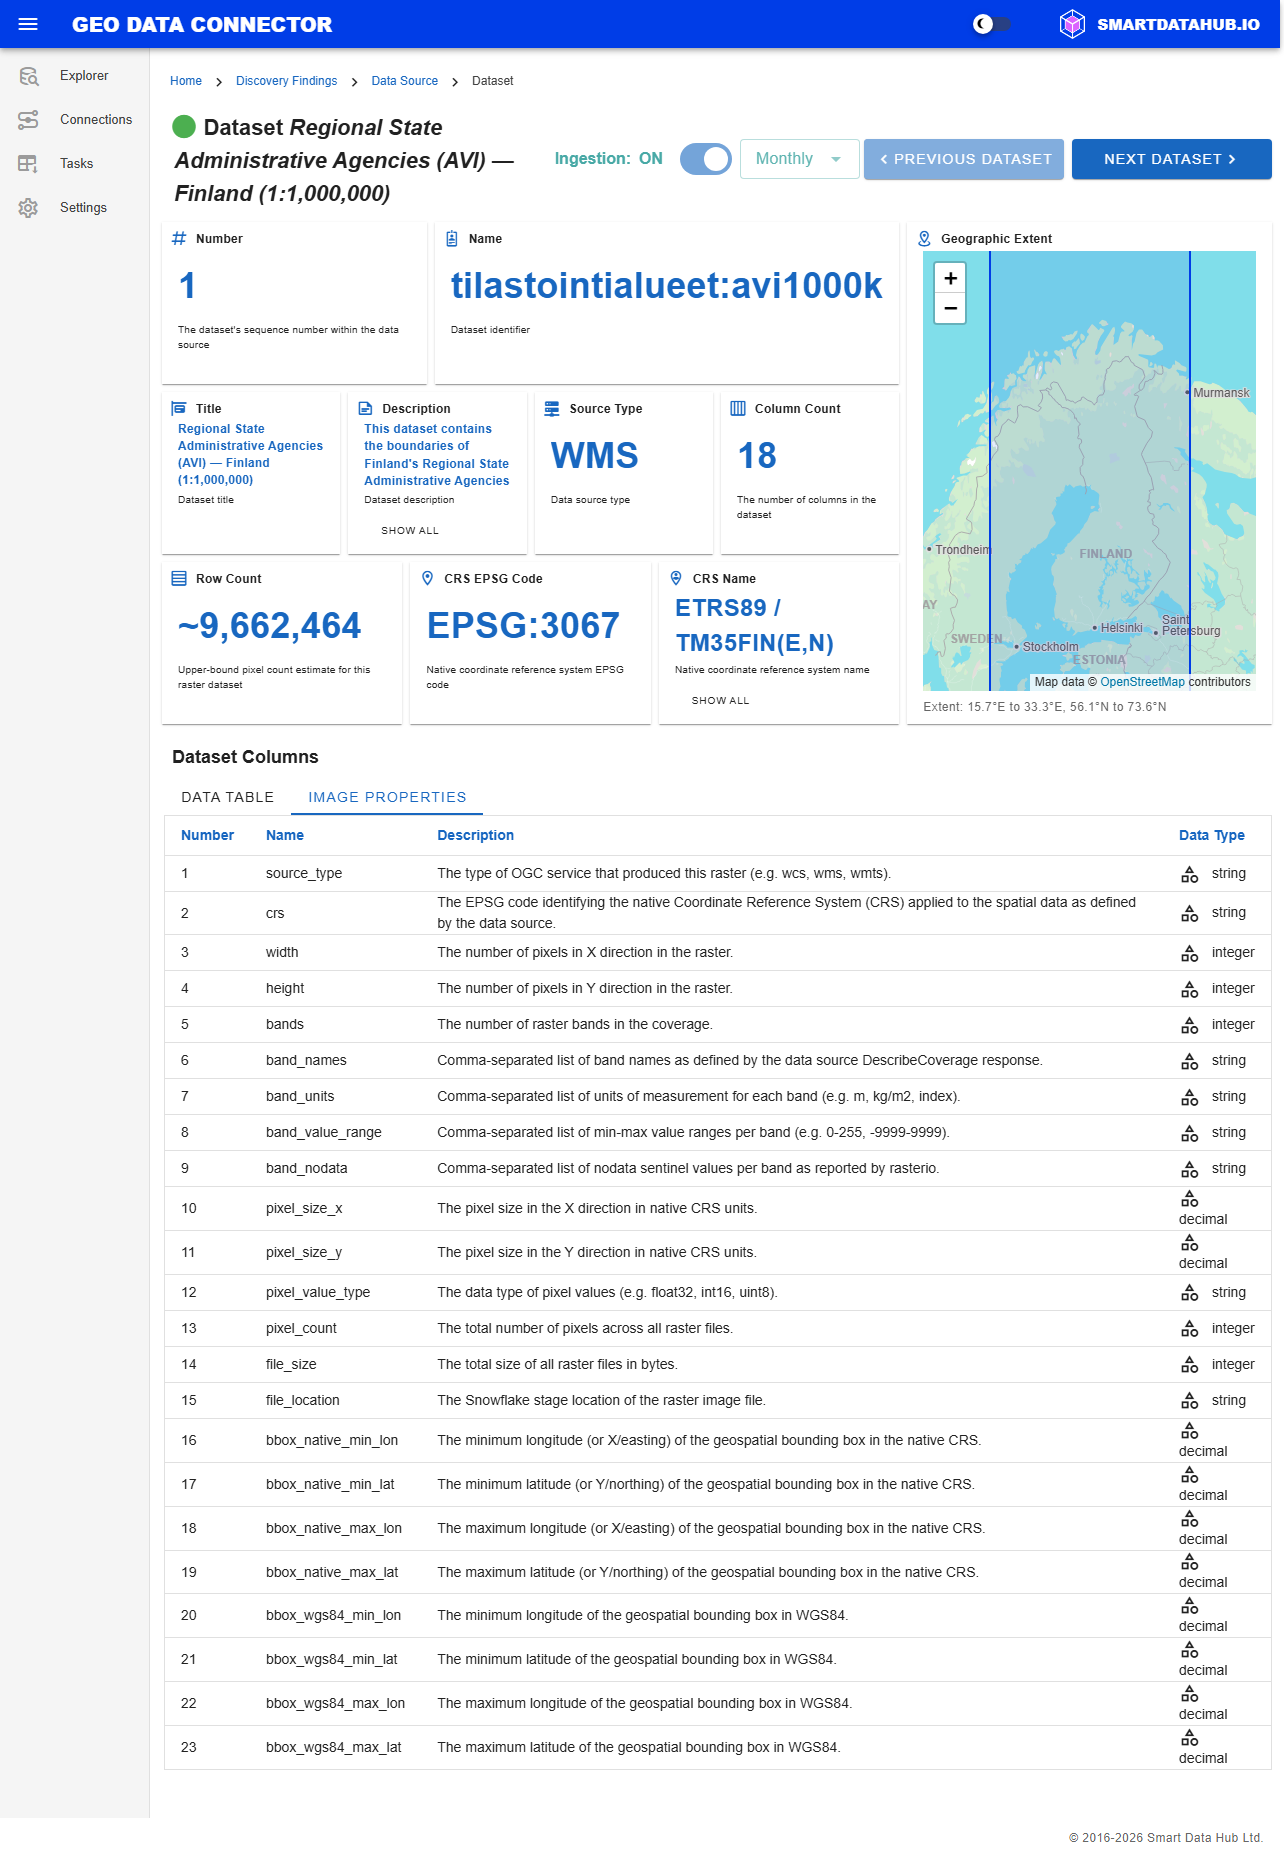
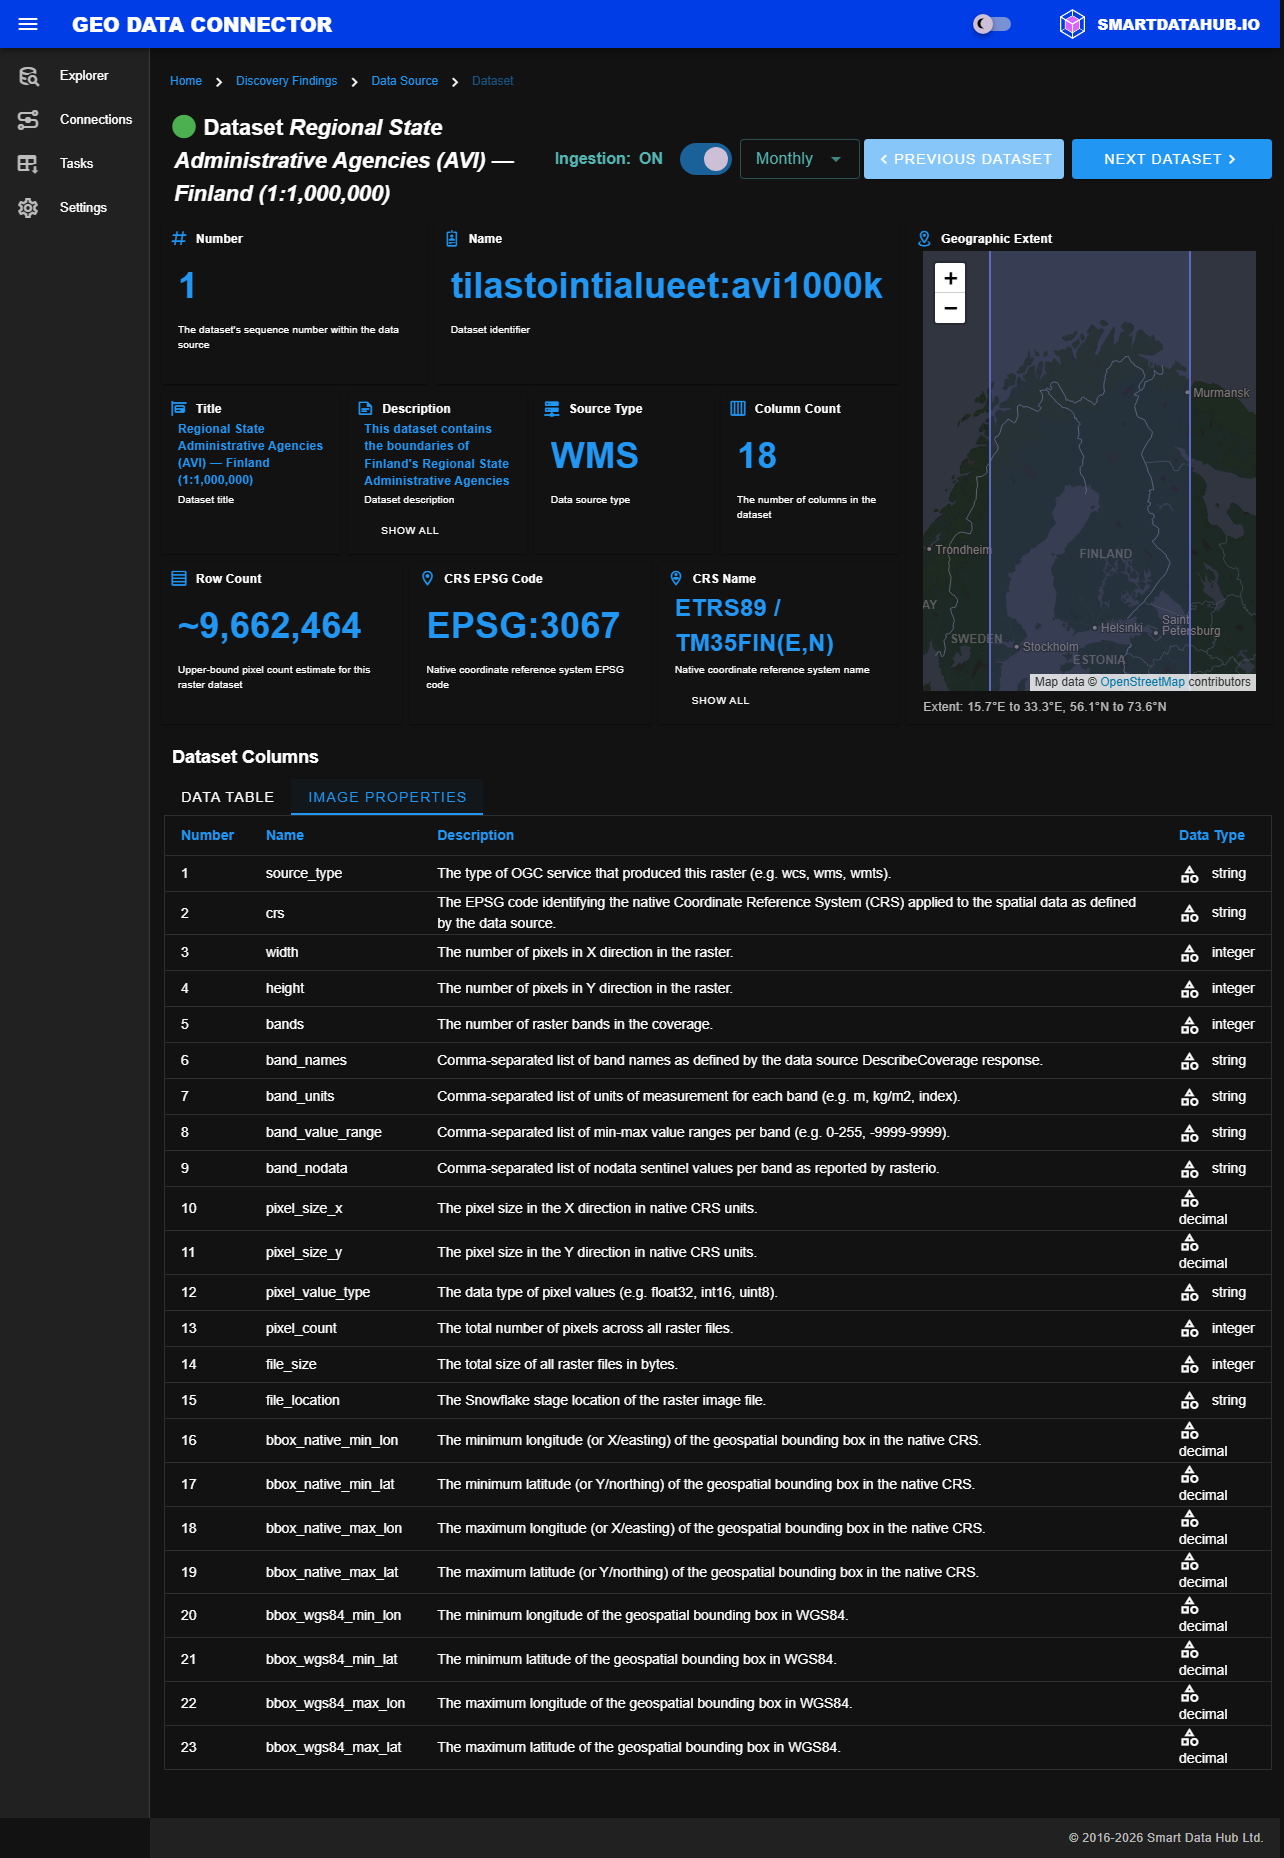
WMS dataset showing the Image Properties tab with raster metadata columns
Navigation
Use the Previous Dataset and Next Dataset buttons at the top to navigate between datasets.
The INGESTION toggle and interval selector let you configure automated ingestion directly from this view. See Ingesting Datasets for details.
Free edition: The schedule selector shows only On-demand. See Editions for all Free edition limits.
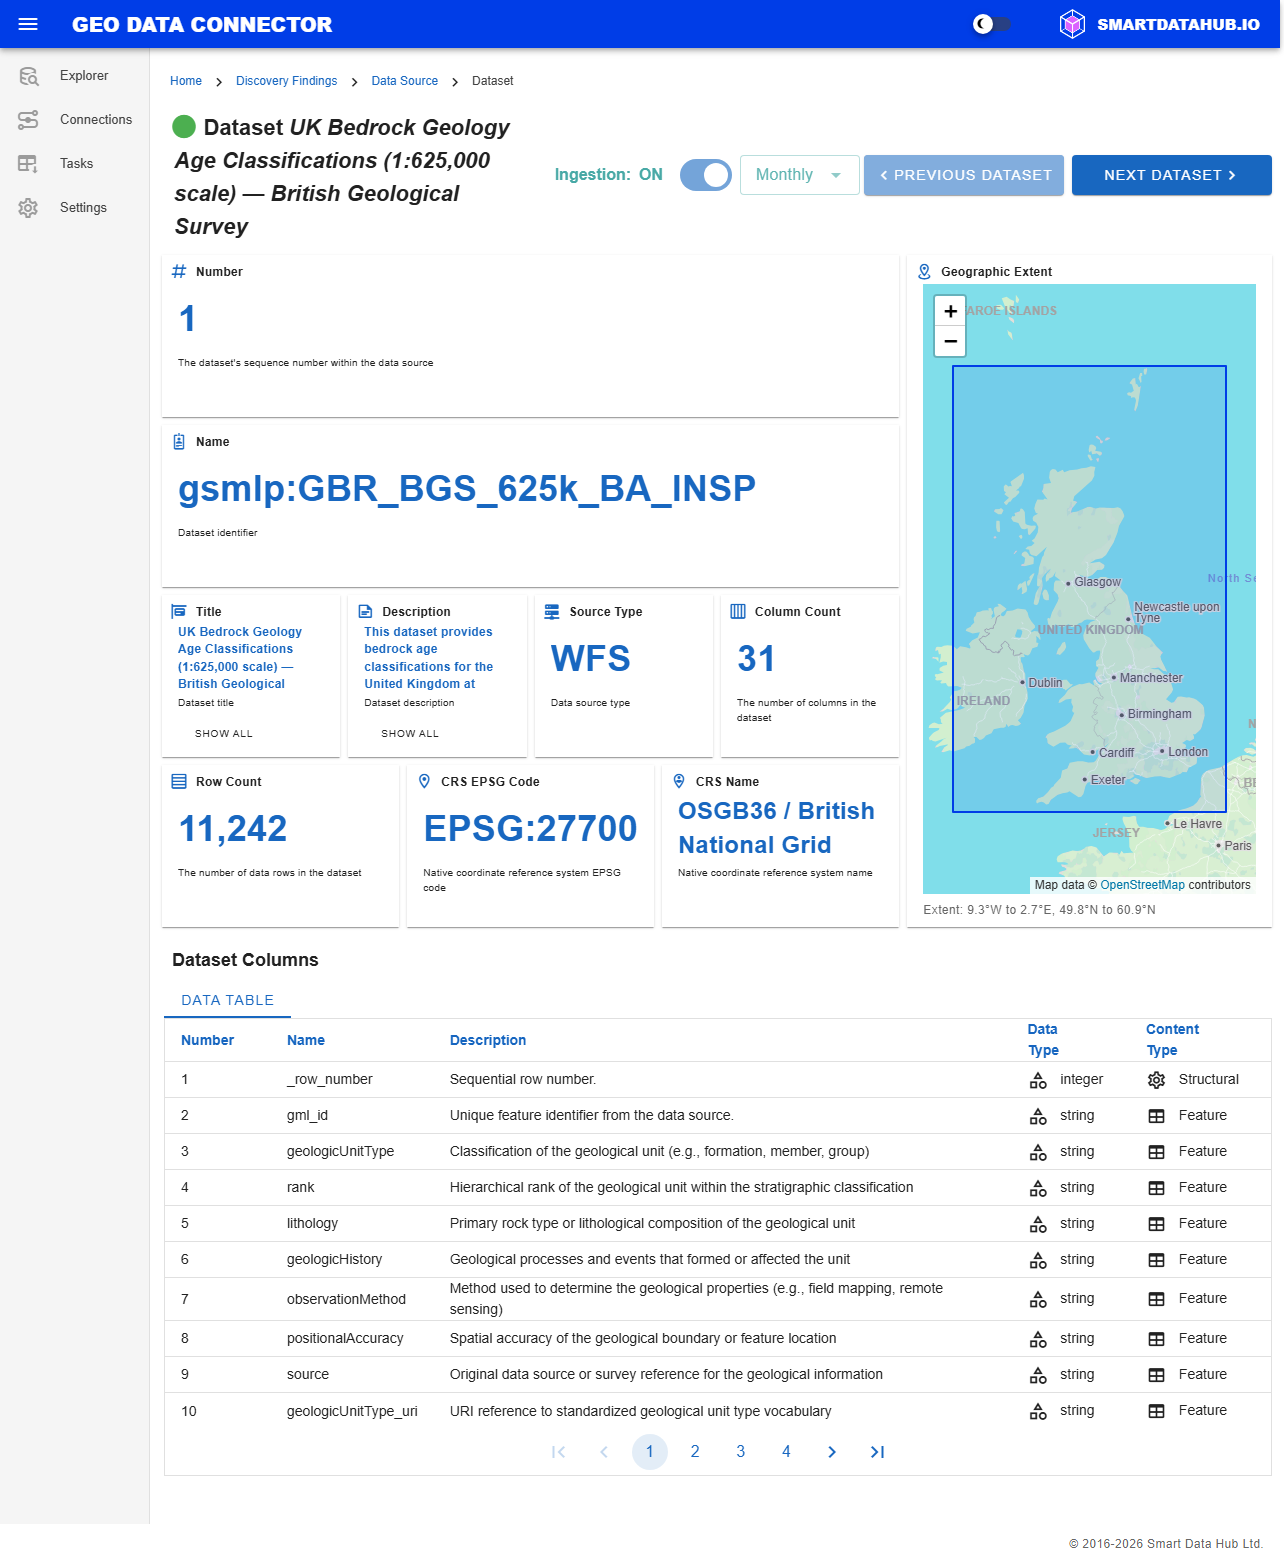
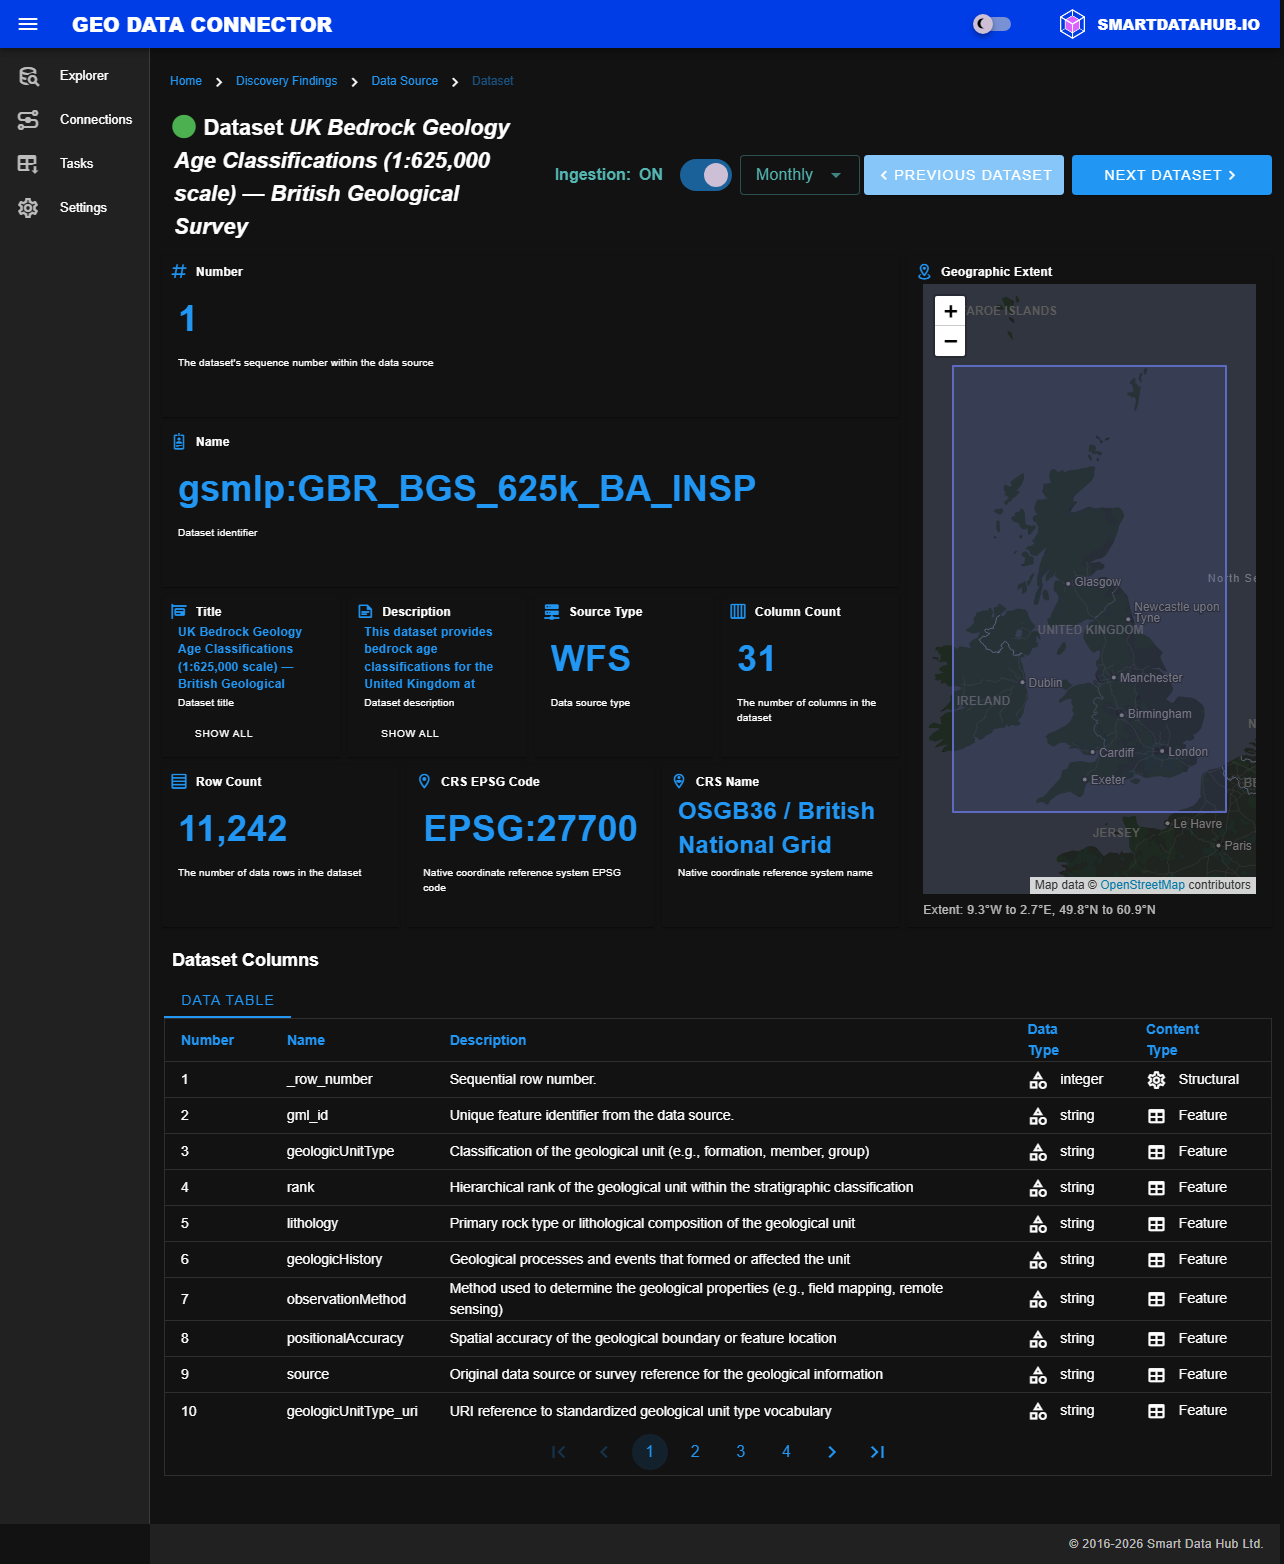
Dataset Information view with metadata cards, ingestion controls, and column schema